Reporting
Know what happened, not just what was sent
Every campaign ends in real figures: what arrived, what people clicked, who opted out and what it cost. Read the whole project over any dates you choose, then take the detail with you.
- DeliveryMessage by message
- ClicksTotal and unique
- RangeAny dates you pick
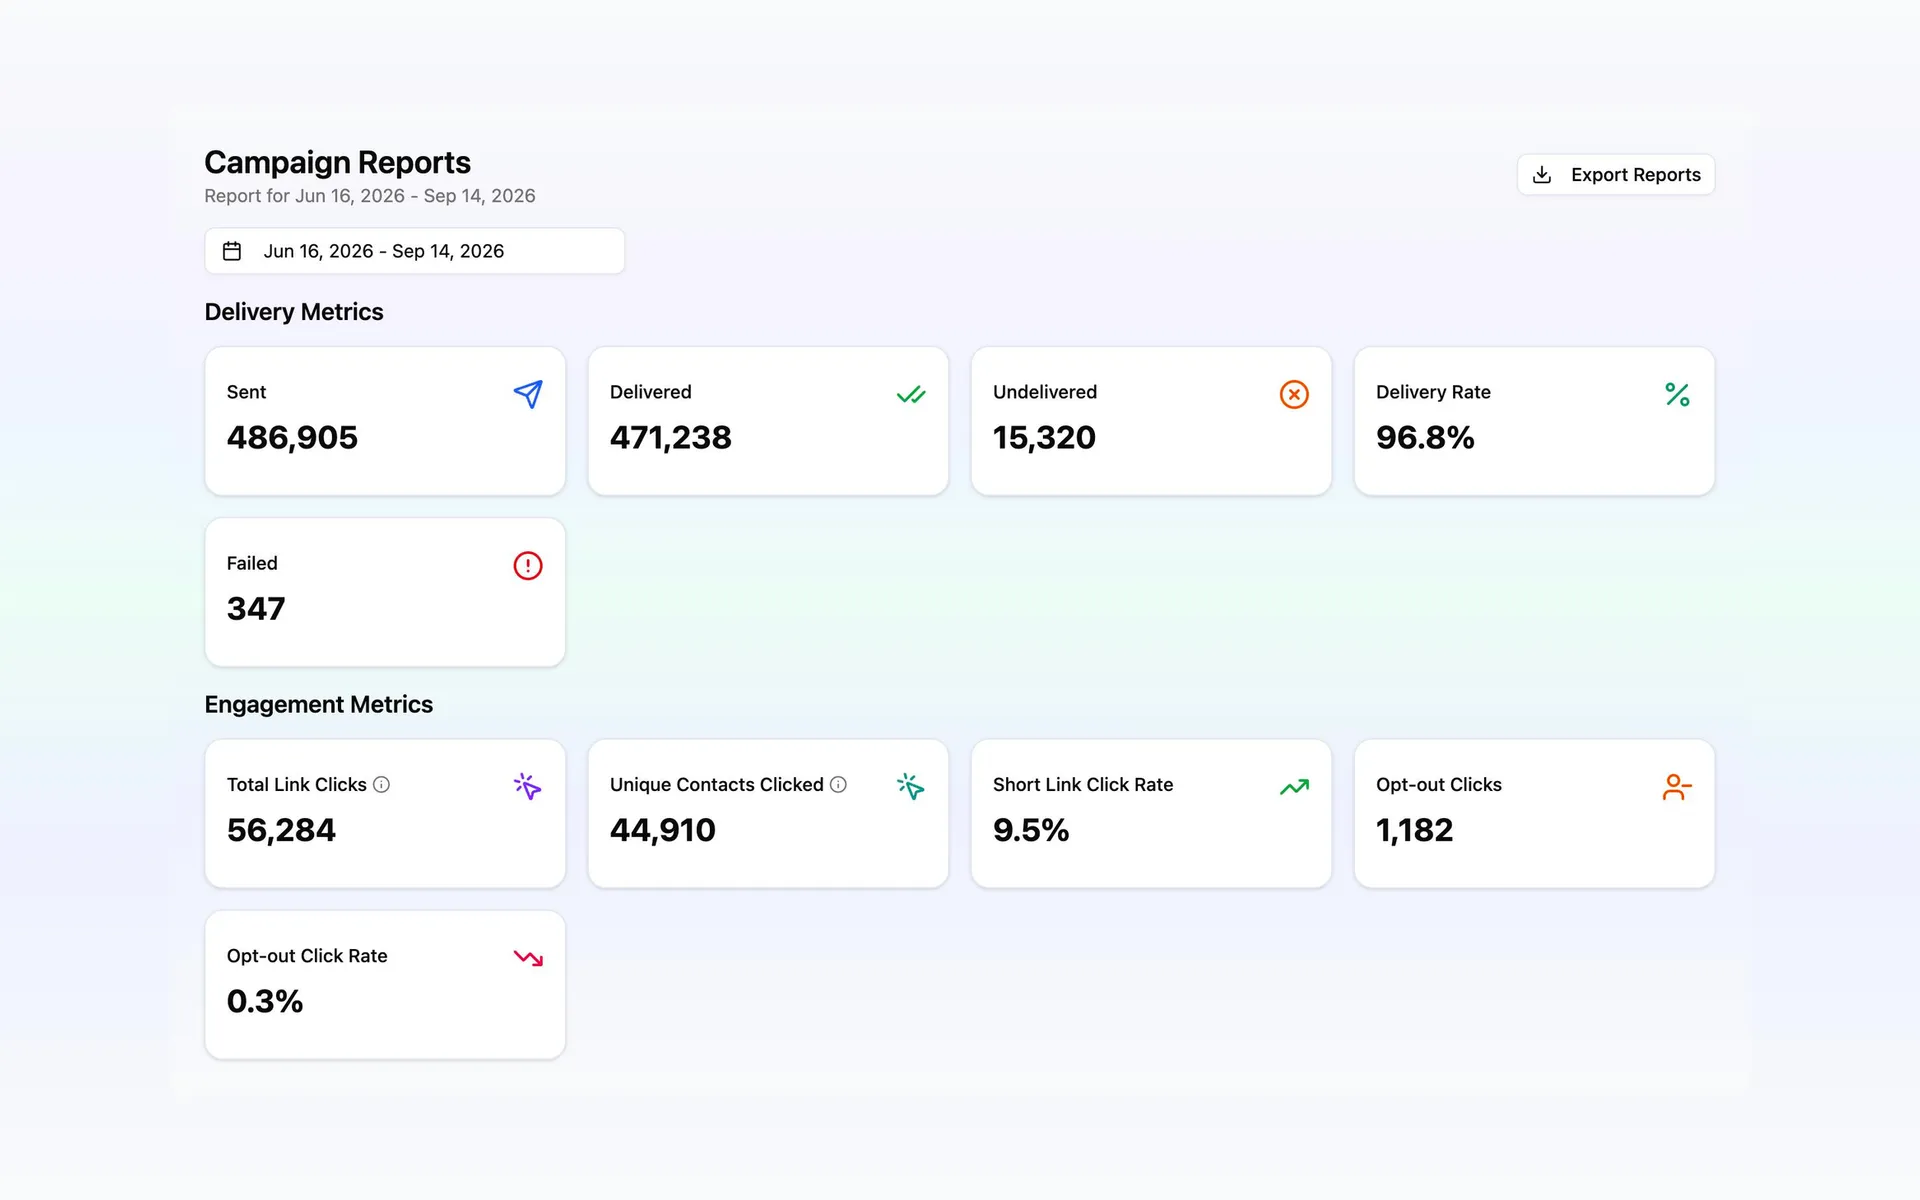
Sent is not the same as delivered
Both numbers, side by side
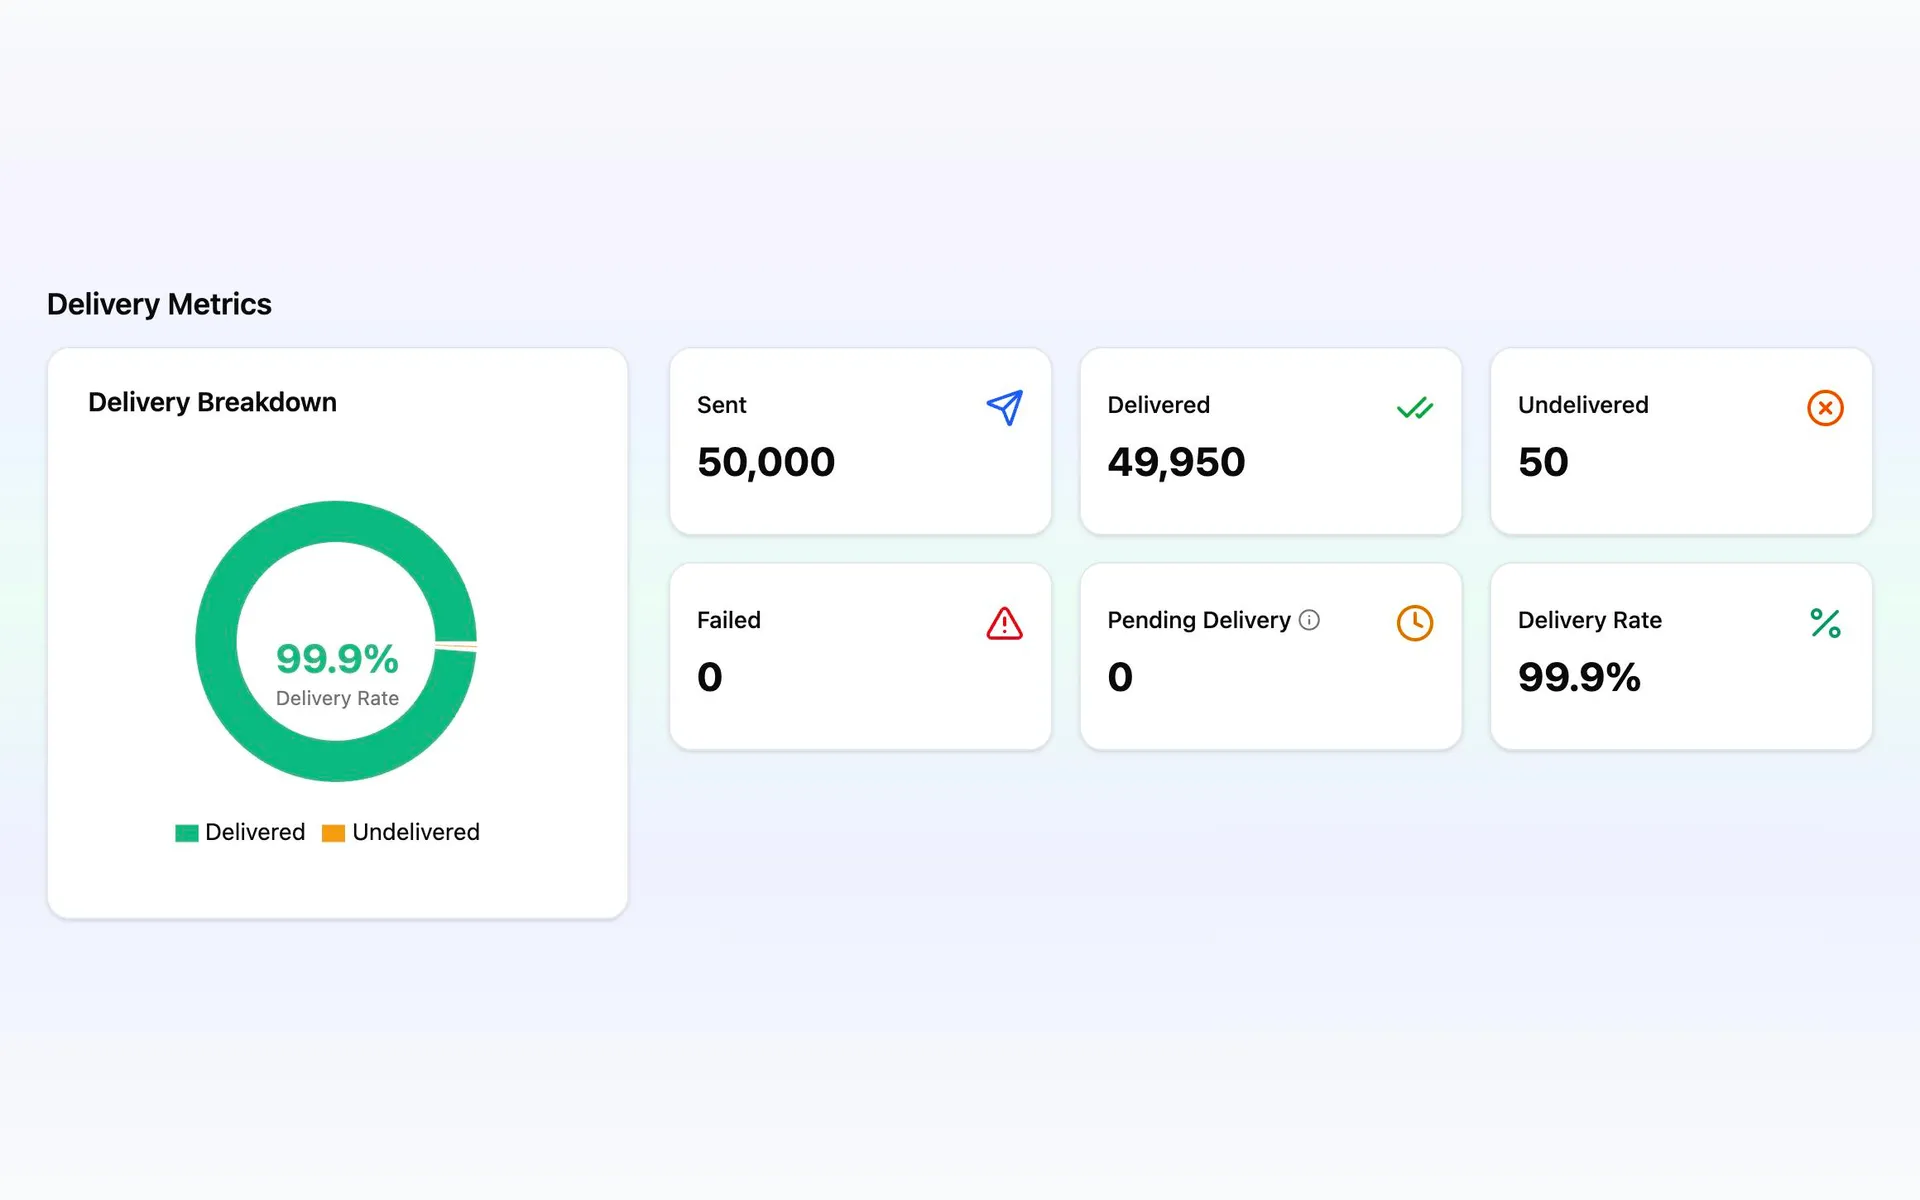
Sent, delivered, undelivered and failed sit together with the delivery rate, and a breakdown chart shows the split without you reading a single figure.
Pending is its own answer
A message the network has taken but not yet reported on counts as pending, never as a failure. You watch it resolve while the send is still finishing.
Nothing to build first
The numbers are on the campaign itself, from the moment it starts sending. No report to configure, no dashboard to assemble.
Clicks you can put a name to
Taps, and the people behind them
Total clicks counts every tap, including the same person coming back. Unique contacts clicked tells you how many people that actually was.
Measured against what arrived
Click rate and opt-out rate are worked out from delivered messages rather than from what you sent, so an undelivered message never flatters the result.
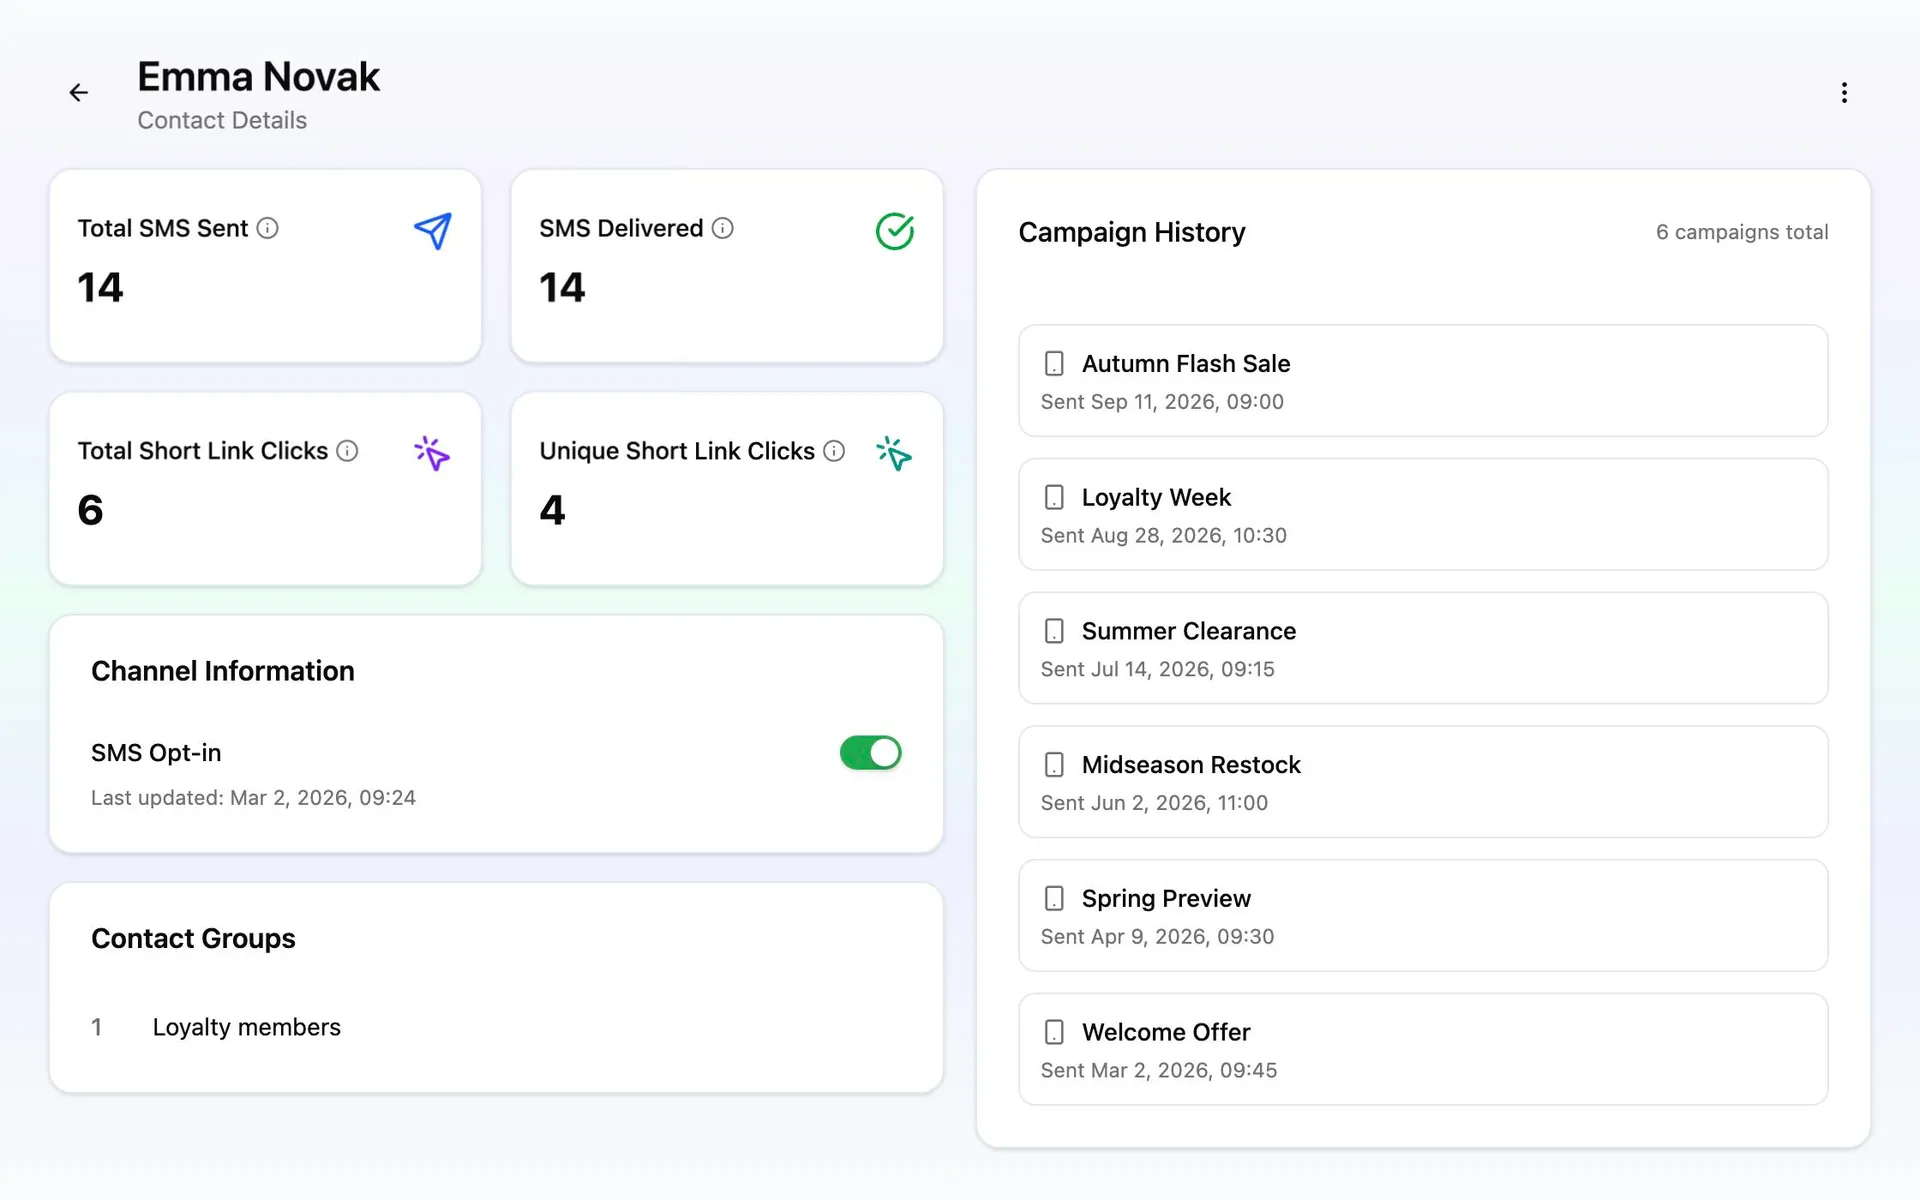
Down to one customer
Open a contact to see what they have been sent, what reached them, what they clicked, and every campaign they have received.
What the campaign actually cost
Your own spend, divided the four ways worth knowing. Every figure comes from the messages that went out, not from an estimate.
Cost per message
What one message cost across the whole send, long names and all.
Cost per delivery
The same spend counted only against the messages that arrived. This is what reaching one person is really worth.
Cost per segment
The price of the unit a network bills, carried to the decimal places that start to matter at volume.
Segments per message
How many segments your average message needed. Anything above one is a writing decision, and one you can take back.
The whole project, over any dates you choose
Reports opens on the last 90 days. Switch to this month, last month or the last 30 days, or set your own dates, and every figure and chart below re-reads.
What went out
Campaigns, people reached, the segments they used and what you spent across the range.
What arrived
Delivered, undelivered and failed with the rate, drawn as a funnel from the audience you chose down to the messages that landed.
What people did
Clicks and opt-outs with their rates, and repeat clicks set against the number of people who made them.
A read on the way in
The home screen carries the numbers you would otherwise go looking for.
Four figures, and which way they moved
Your latest campaigns
A day at a time
Dates worth planning around
Take the detail with you
Two exports. The range you are reading leaves as a single summary line, and any campaign that has sent leaves as one row per person. Small files download at once; a large one prepares in the background and starts itself when it is ready.
Who it went to
The customer and the phone number behind every message.
What they actually received
The message as it left, filled in for that person, rather than the campaign text you wrote.
What happened to it
Send and delivery status with their times, the segments it used, and a reason when something failed.
What they did next
Clicks and opt-out activity, customer by customer.